

🔍 2025 at a Glance
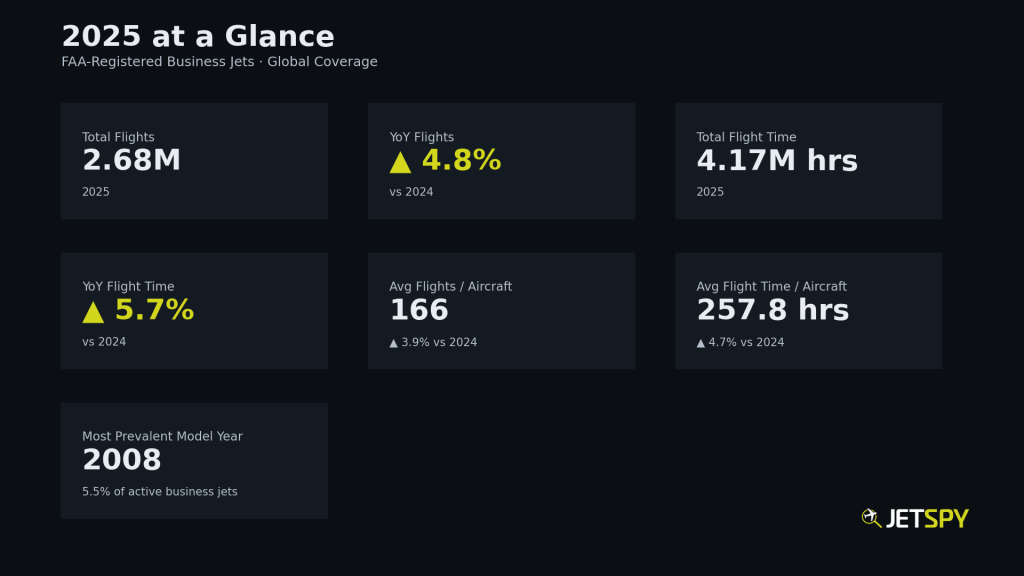
Business aviation activity in 2025 continued to demonstrate resilience and adaptability amid an evolving economic and geopolitical backdrop. While macroeconomic conditions, interest-rate dynamics, and shifting corporate travel policies likely influenced demand at the margins, overall utilization remained robust across much of the sector.
Total flight activity and aggregate flight time both increased year over year, demonstrating that business aviation continues to serve as a critical mobility solution for corporate, private, and institutional users. Average utilization per aircraft also trended modestly higher, pointing to sustained reliance on existing fleets rather than broad, rapid fleet expansion.
Taken together, the data indicates a market that is neither overheated nor retreating—but instead settling into a more normalized, operationally efficient rhythm following the volatility of prior years.
📍 Top Events of 2025

Certain dates in 2025 stood out sharply from normal traffic patterns, driven by major events that concentrated business jet arrivals into specific regions well above their typical daily averages. These spikes represent the largest single-day variances in arrival activity, calculated by comparing event-day traffic against average daily arrivals derived from annual totals.
Notable examples include:
- The Masters Tournament (Augusta, GA) — A perennial driver of concentrated private aviation demand tied to hospitality, sponsorship, and high-net-worth attendance.
- Trump 47 Inauguration (Washington, DC region) — Reflecting the continued role of business aviation in political, diplomatic, and lobbying-related travel.
- The Kentucky Derby (Louisville, KY) — A short-duration but high-intensity surge tied to elite sporting and social events.
These event-driven surges highlight how business aviation responds not just to economic cycles, but to calendar-specific moments where time sensitivity, access, and discretion are paramount.
🛬 Top Routes of 2025
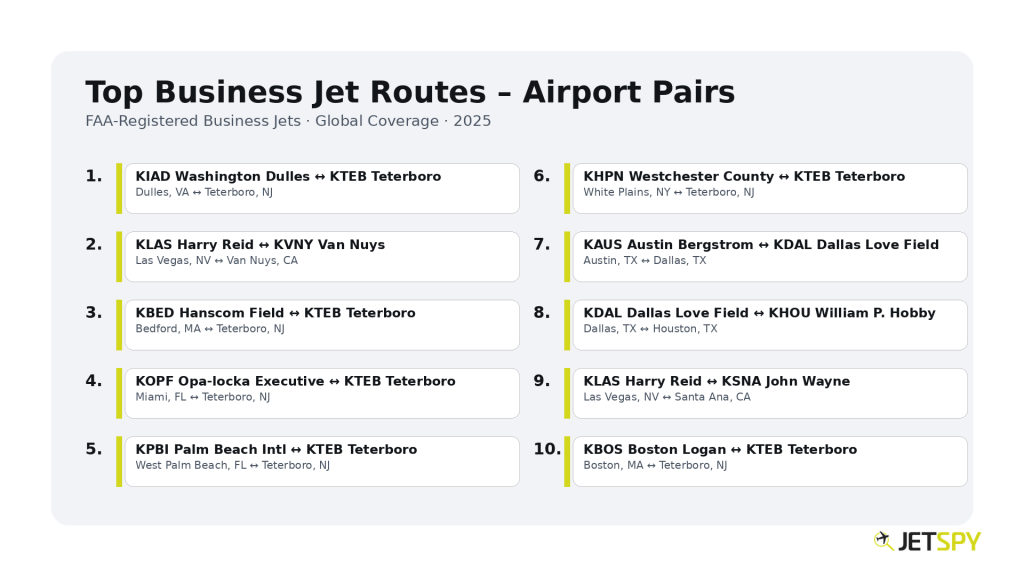
The most frequently flown business jet routes in 2025 reveal clear patterns around political access, financial centers, and premium leisure travel. These city pairs represent sustained, bidirectional demand rather than one-off movements.
The most prominent route—Washington Dulles (KIAD) ↔ Teterboro (KTEB)—underscores the enduring and increasing importance of Washington, DC as a destination for policy, regulatory, and lobbying activity, with Teterboro serving as a key gateway for the New York metropolitan area. This pairing saw traffic nearly 10% higher than in 2024, overtaking Harry Reid (KLAS) ↔ Van Nuys (KVNY) for the top route of 2025.
Other top routes reflect:
- Core business corridors linking major economic hubs
- Seasonal and lifestyle-driven travel between financial centers and leisure destinations
- Short-haul, high-frequency movements where schedule control outweighs commercial alternatives
Together, these routes illustrate how business aviation continues to mirror the geographic priorities of capital, governance, and high-value personal travel.
✈️ Business Jet Fleet by Class
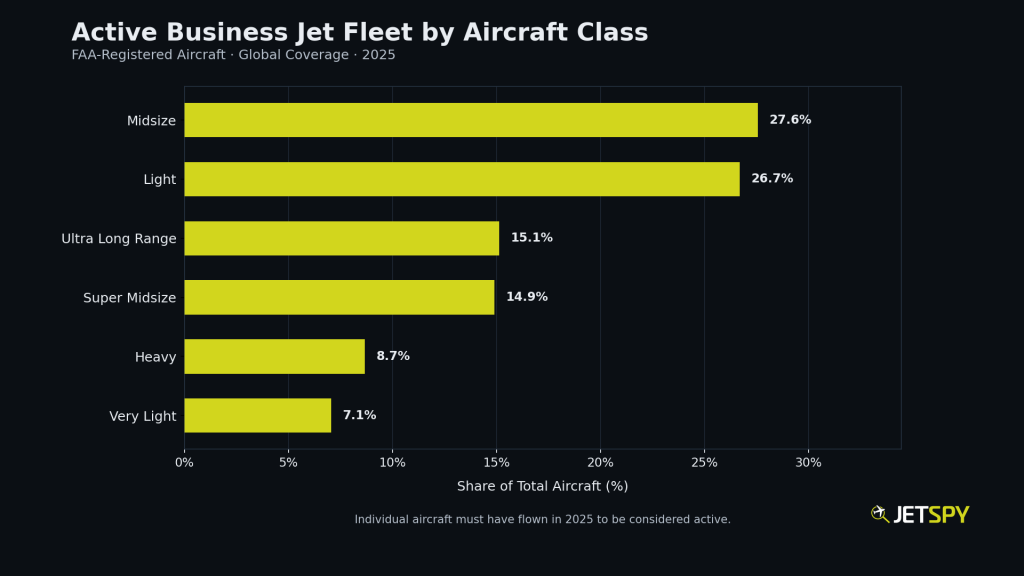
The active U.S. business jet fleet spans a wide range of aircraft classes, each serving distinct operational needs and economic profiles.
- Very Light and Light Jets prioritize efficiency, lower operating costs, and access to smaller airports.
- Midsize and Super-Midsize Jets strike a balance between range, cabin comfort, and flexibility, making them well-suited for regional and transcontinental missions.
- Heavy and Ultra-Long-Range Jets deliver global reach, larger cabins, and nonstop intercontinental capability, albeit at significantly higher acquisition and operating costs.
The distribution of active aircraft across classes reflects a diverse market where no single mission profile dominates—and where fleet composition remains closely tied to specific use cases rather than uniform growth.
🏢 Business Jet Market Share
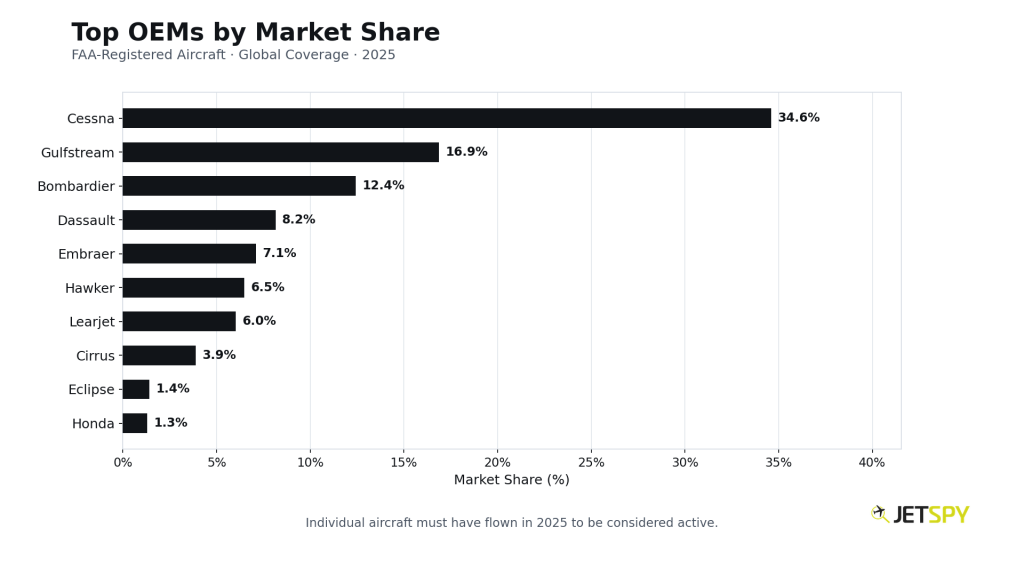
Market share among business jet manufacturers in 2025 remains concentrated among a small group of established OEMs with long production histories, global support networks, and large in-service fleets.
Manufacturers such as Cessna (Textron), Gulfstream, Bombardier, Dassault, and Embraer continue to anchor the market, benefiting from decades of aircraft deliveries and sustained operator loyalty. While newer platforms and incremental fleet renewal continue, legacy models still account for a substantial portion of active utilization.
This distribution highlights the long lifecycle of business aircraft and the enduring influence of OEMs that have successfully paired performance, reliability, and support infrastructure over time.
📈 Top Business Jet Models of 2025
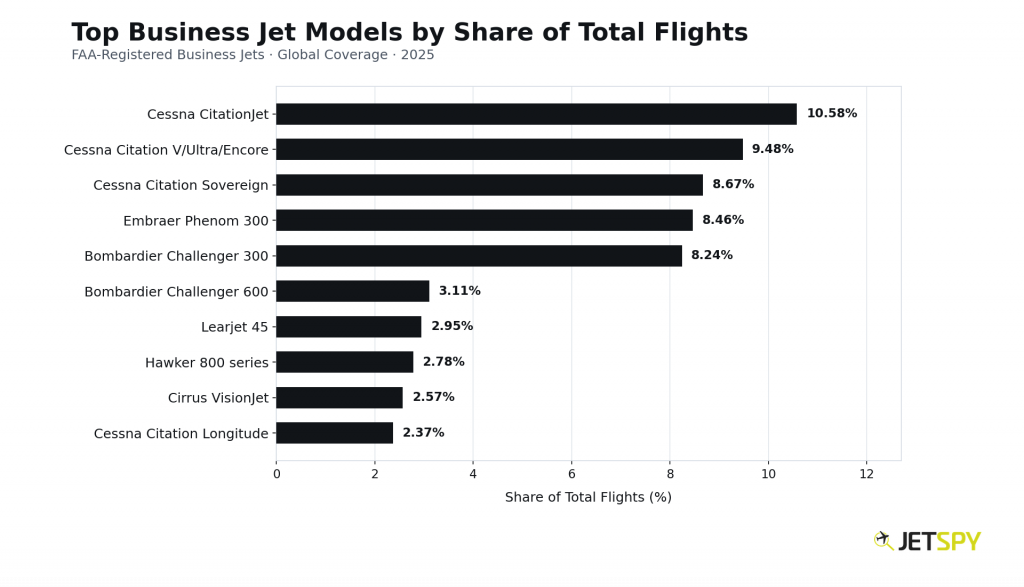
When viewed at the model level, flight activity becomes even more concentrated. The top ten aircraft models by total flight counts represent a significant share of all business jet flights in 2025 (59.2%).
Notably, Cessna jets dominate with four of the top ten models by total flight volume within the business jet fleet. With these particular models accounting for over 30% of business jet flights overall, the metrics underscore the breadth and depth of the Cessna fleet. When considering additional business jet models outside of the top ten, Cessna’s share of overall flight volume is even higher.
High-utilization workhorses—often optimized for short- to mid-range missions—continue to fly frequently despite the availability of newer aircraft This pattern reinforces a key theme of business aviation: utilization is driven as much by mission fit and operating economics as by aircraft age or prestige.
📅 Fleet Aging
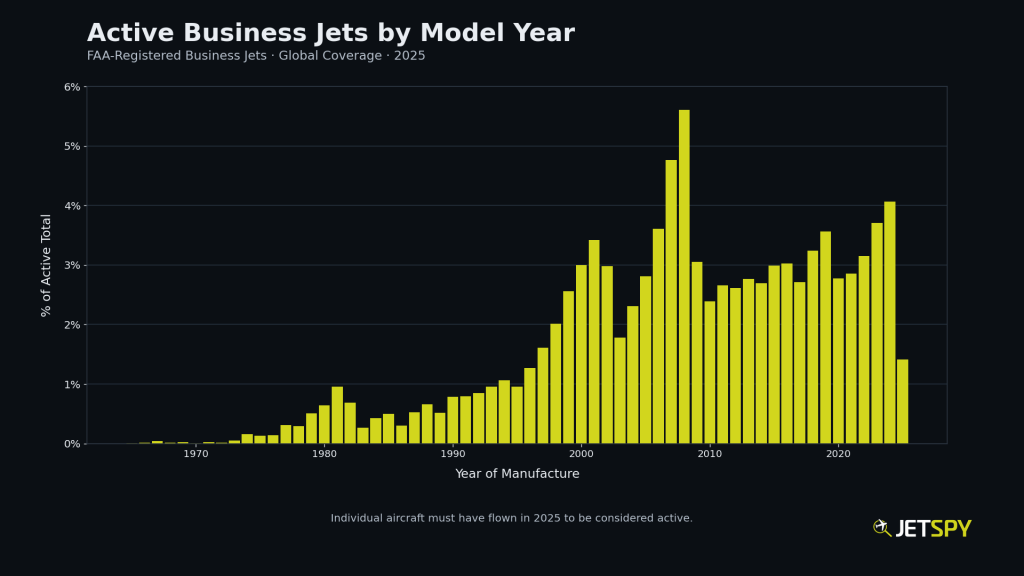
The distribution of active business jets by model year provides a snapshot of fleet aging and renewal dynamics. The most prevalent model year among active aircraft remains 2008, a notable inflection point that coincides with a major production cycle prior to the global financial crisis.
While newer aircraft continue to enter service, the data highlights the longevity of business jets and the industry’s reliance on well-maintained, mature airframes. Fleet turnover remains gradual, shaped by capital costs, certification timelines, and evolving mission requirements rather than rapid replacement.
📄 Summary
JetSpy’s 2025 U.S. Business Jet Activity Report illustrates a market defined by consistency, selectivity, and strategic utilization. Activity patterns reflect where capital moves, where decisions are made, and where access and efficiency matter most.
Behind these trends is a growing need for clarity. Business aviation generates vast amounts of raw movement data, but meaningful insight requires more than basic tracking—it requires context, consistency, and scale. This report represents a snapshot of what becomes possible when unfiltered ADS-B flight data is intelligently processed and made easily accessible via the JetSpy platform.
For Business Aviation professionals—including charter brokers, FBOs, MROs, and airport authorities—the JetSpy platform supports heightened awareness and delivers actionable market intelligence.
For Financial Services firms, the platform delivers visibility into corporate aviation activity, as well as informing underwriting and risk assessment activities.
For Research and Media organizations, it offers a grounded, data-driven view of how business aviation aircraft and operators move— beyond anecdote or headline trends.
JetSpy delivers this perspective through unfiltered ADS-B data, intelligently processed and efficiently presented—giving professionals a clear and customizable view of real-world aircraft activity. JetSpy is redefining how actionable aviation intelligence is accessed and applied.
To view self-service subscription options, check out our monthly (or yearly) plans.
For corporate sales inquiries or questions, please contact:
JetSpy Enterprise Sales
[email protected]